The history of molecular biology is often told through discoveries: DNA, the double helix, the genetic code, and the technologies that made genes readable, alterable, and clinically useful. A less visible part of that history is the intellectual shift that made heredity feel like a physical problem. Schrödinger’s What Is Life? asked how living systems could preserve molecular order, store hereditary information, and resist thermodynamic equilibrium using the laws of physics. Michael Smith later helped turn genetic information into an experimentally editable object through site-directed mutagenesis. The sequence matters: biological order becomes a molecular question, and molecular information becomes an experimental variable.
This publication continues that sequence at a smaller scale. Instead of asking only where p53 binds or which genes change abundance, it asks how a p53 signal is routed between molecular layers. Transcription produces RNA, but total RNA abundance is not identical to translational availability. RNA degradation, nuclear export, ribosome loading, codon composition, RNA-binding proteins, and stress-dependent changes in translation can all separate the amount of RNA in a cell from the amount of RNA associated with polysomes.
This is a computational reanalysis of public, laboratory-generated human cell-line experiments. It is not a new wet-lab experiment, a clinical study, or a public-health analysis. The purpose is narrower: to reproduce a published molecular-biology result, quantify the gap between transcription and polysome association, and test whether that gap transfers across cell lines and independent time courses.
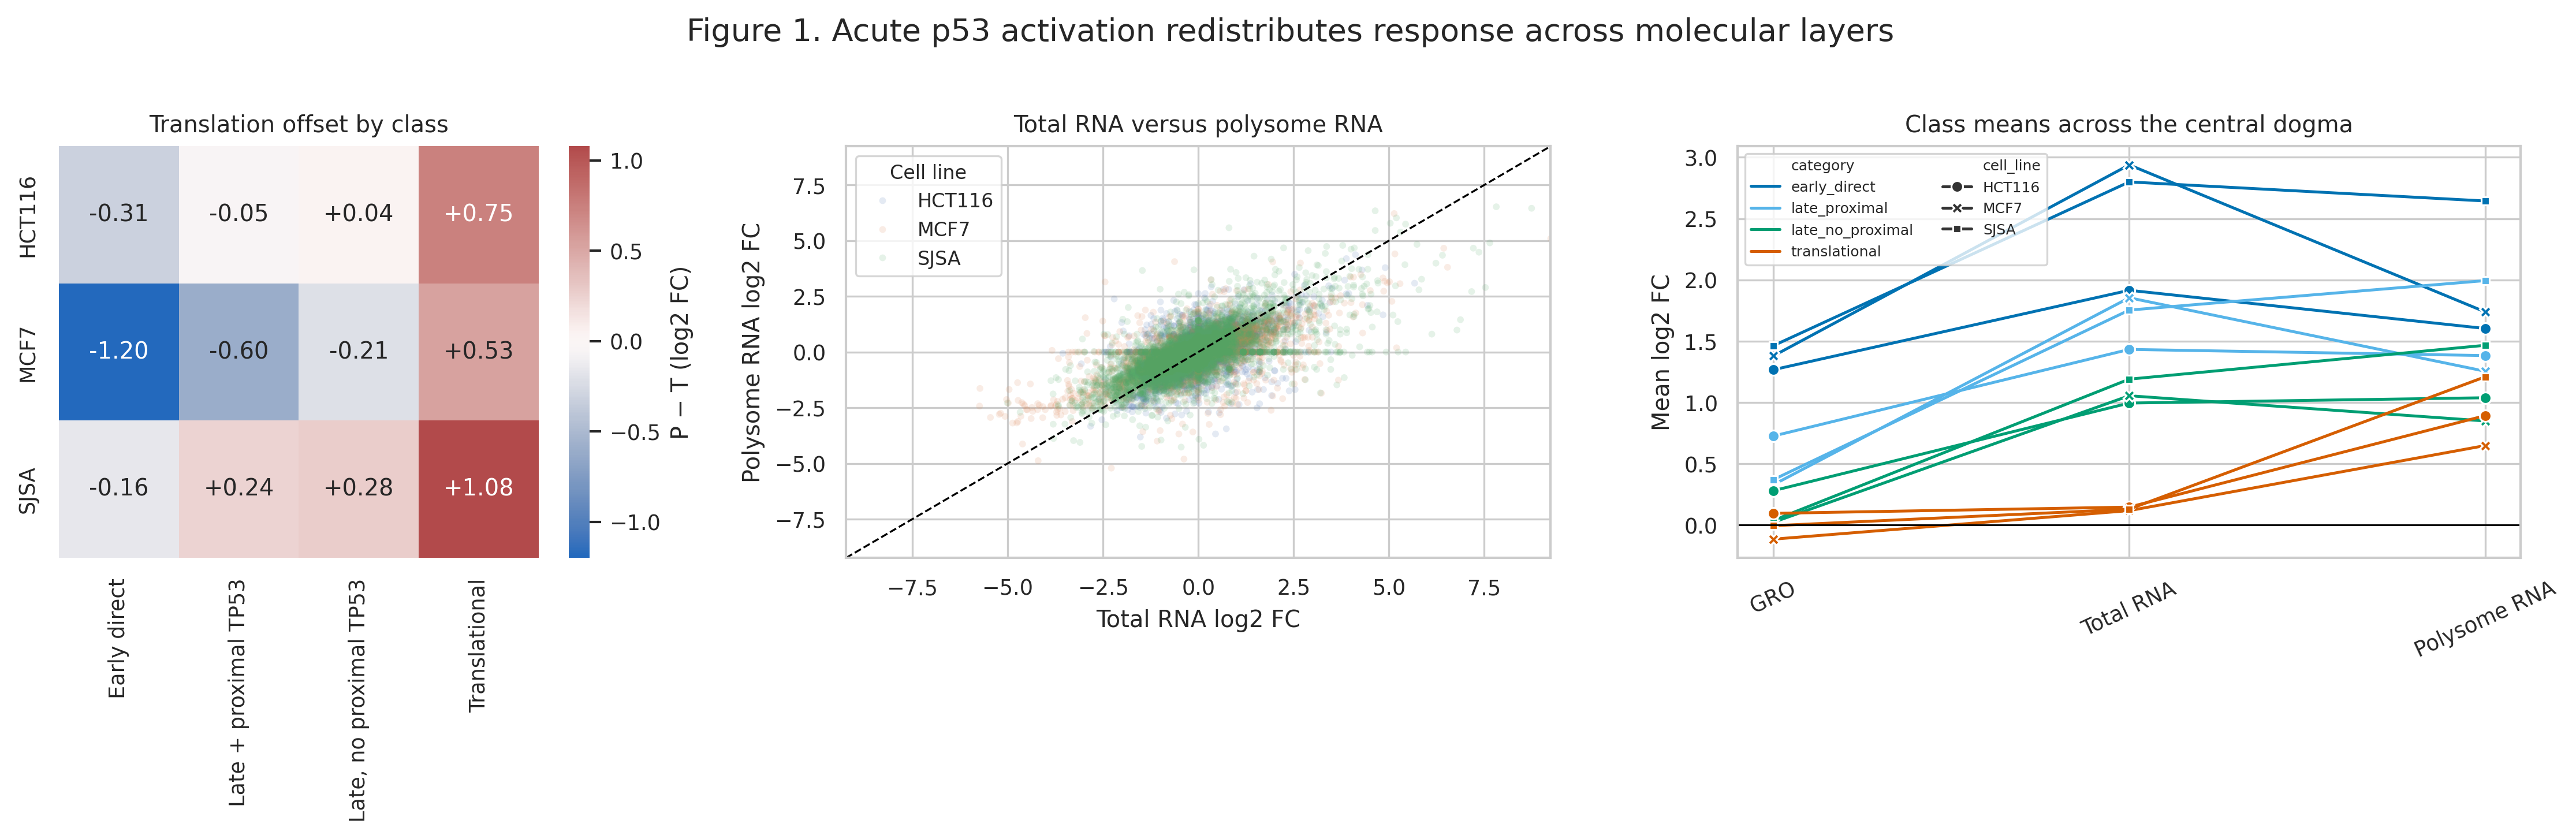
The central finding is a context-sensitive information gate. Acute p53 activation produced strong nascent-transcription and total-RNA responses in early-direct genes, while the source-defined translational class showed relatively little total-RNA change but a positive polysome-minus-total offset in HCT116, MCF7, and SJSA cells. The signal transferred across cell lines, but only partially. The data therefore support a model in which p53 establishes a transcriptional input while cellular state determines which RNAs become disproportionately represented on polysomes.
The result is deliberately modest. A positive polysome offset is not the same thing as a direct translation-rate measurement, and a source-defined class cannot be treated as a wholly independent discovery. The contribution is a reproducible cross-layer and cross-cell-line analysis that converts the published category structure into a more specific, testable model of information routing.
The question: does p53 information route uniformly?
p53 is an appropriate system for this question. It is a stress-responsive transcription factor whose activation can be induced pharmacologically by inhibiting the p53-MDM2 interaction or physiologically through DNA damage. Its response contains direct early targets, later transcriptional programs, and genes whose behavior is not explained by a simple one-step promoter model.
The public multi-omics study underlying this reanalysis measured p53 binding, nascent transcription by GRO-seq, total RNA, and polysome-associated RNA in HCT116, MCF7, and SJSA cells. Its supplemental classification separated p53-network genes into early-direct, late with proximal TP53 binding, late without proximal binding, and translational categories.
That study provides the experimental foundation. The present analysis asks whether a gene’s relative polysome behavior has a transferable component across cell lines. If a translation-prone state exists, is it conserved across cellular contexts or reconstructed independently in each cell line? Independent total-RNA time courses then provide a second test: do the class differences survive outside the primary experiment, and does p53 loss preferentially blunt early-direct induction?
The analysis used four preregistered-style expectations. Early-direct genes should show a strong GRO-seq response and substantial total-RNA induction. Translationally classified genes should show a larger polysome-minus-total offset. A source-defined translational class should retain some positive offset in a target cell line after matching for baseline expression and total-RNA response, but the effect should be smaller than in its source line. Independent RNA-only time courses should reproduce the temporal separation, while p53 loss should preferentially blunt early-direct induction.
The primary reanalysis reproduces the experimental record
The primary matrices contained 25,369 genes for total RNA and polysome-associated RNA, with 16 and 12 samples, respectively. GRO-seq tables contained approximately 14,000 to 16,000 gene-level entries per cell line after transcript identifiers were collapsed to gene identifiers. Counts were normalized with median-of-ratios size factors and transformed as log2(normalized counts + 0.5).
As a quality check, rederived fold changes were compared with the original authors’ significant-gene tables in Supplemental Files S2 and S3. Across HCT116, MCF7, and SJSA, Spearman correlations between the reanalysis and published log2 fold changes were 0.9992 to 0.9999 for both total RNA and polysome RNA. Median absolute differences ranged from 0.025 to 0.198 log2 units. The matrix-level calculations therefore reproduce the published effect scale closely enough for the class-level comparisons below.
For every gene, the analysis defined T as total-RNA log2 fold change, P as polysome-associated-RNA log2 fold change, G as GRO-seq log2 fold change, and O = P - T as the translation offset. A positive O means that a gene’s representation in the polysome fraction rose more than its total abundance. A negative O means that polysome representation lagged behind the total-RNA change. O is a relative routing measure, not a direct measurement of protein synthesis.
This distinction is essential. The study does not claim that a positive offset proves a higher protein concentration, nor that a negative offset proves translational repression. The offset identifies departures from proportionality between two measured RNA pools. That is exactly the layer at which the molecular question becomes testable.
The translation layer separates from the early-direct response
The central pattern is coherent across all three primary cell lines. The early-direct class showed mean O values of -0.31 in HCT116, -1.20 in MCF7, and -0.16 in SJSA log2 units. The source-defined translational class showed +0.75, +0.53, and +1.08, respectively. Early-direct genes had strong nascent-transcription and total-RNA responses. Translational genes had little average total-RNA change, little average GRO-seq change, and a positive polysome-associated response.
The MCF7 early-direct group is especially informative. It had the strongest mean total-RNA induction, +2.94 log2 units, but the most negative polysome offset, -1.20. A large transcriptional response was therefore not automatically accompanied by proportional polysome representation. The result cautions against treating total RNA as a universal proxy for the pool of transcripts most available to ribosomes.
The direct class contrast was large in each line: translational minus early-direct mean O was +1.06 in HCT116, +1.73 in MCF7, and +1.23 in SJSA. Label-permutation tests across genes gave two-sided p = 0.0002 for each comparison under 5,000 permutations. These values should not be interpreted as independent biological replicates. The gene is the sampling unit for an exploratory class-level contrast, and the class definition itself is inherited from the source study.
The result is best read as a separation of molecular layers. Early-direct genes behave like a transcriptionally driven response. Translational genes behave like transcripts whose polysome representation changes more than their total abundance predicts. The two groups are not interchangeable, even though both are part of the same p53 response network.
A translation-prone property partially transfers between cell lines
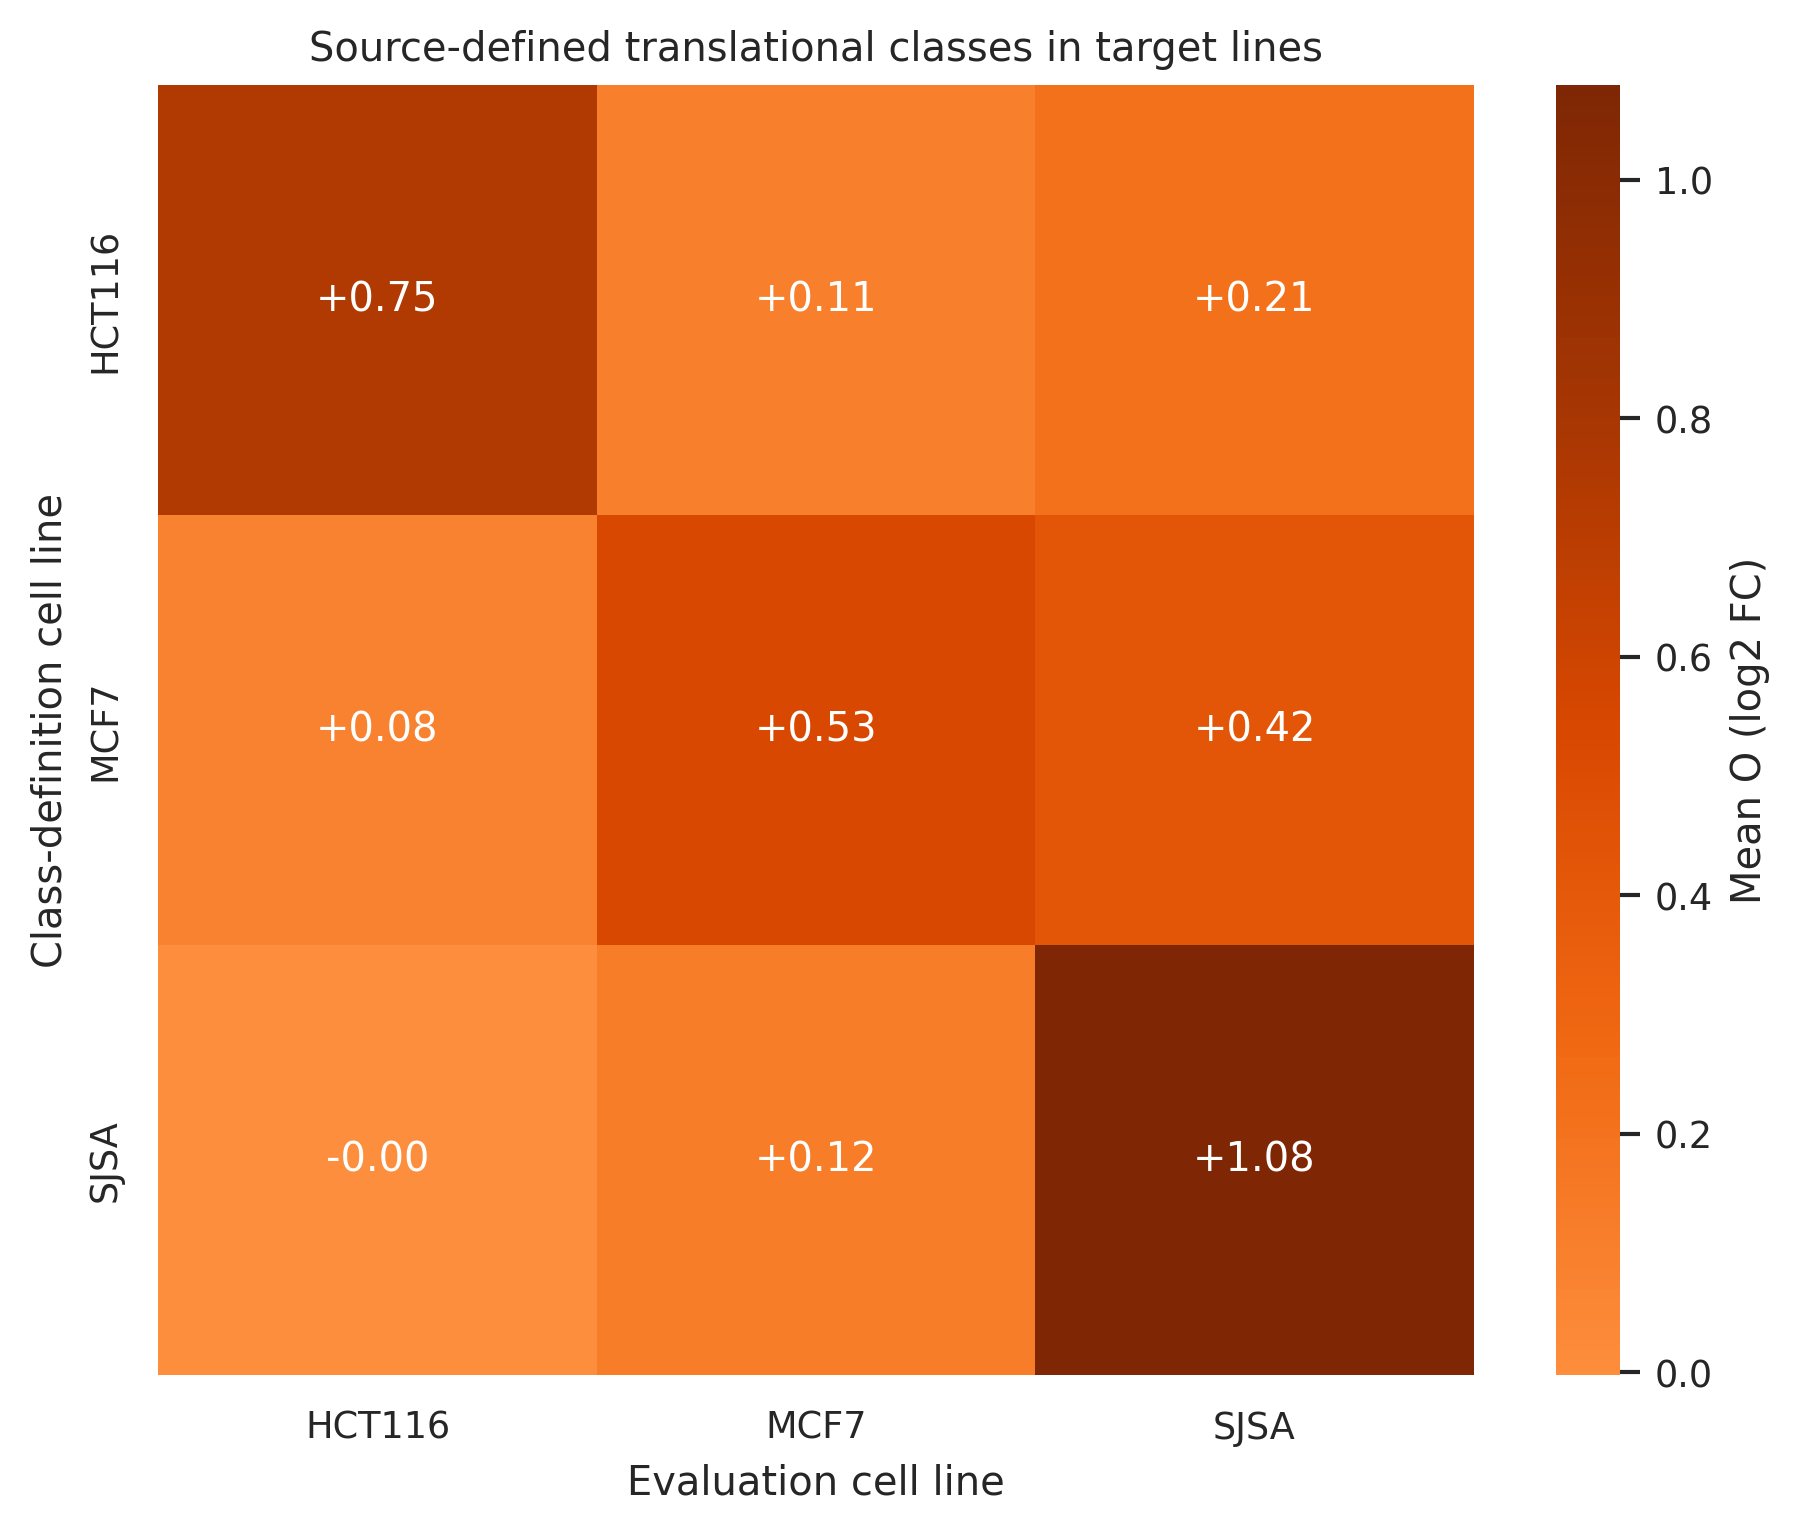
The original classes are cell-line-specific. To separate a transferable gene property from a cell-specific label, each line’s upregulated translational gene set was treated as a source-defined set and evaluated in the other two lines. The target-line mean O was compared with a null distribution created by sampling target genes matched approximately on baseline total-RNA abundance and total-RNA Nutlin response.
The diagonal values were +0.75 for HCT116 evaluated in HCT116, +0.53 for MCF7 evaluated in MCF7, and +1.08 for SJSA evaluated in SJSA. Off diagonal, the HCT116 set scored +0.11 in MCF7 and +0.21 in SJSA; the MCF7 set scored +0.08 in HCT116 and +0.42 in SJSA; and the SJSA set scored -0.00 in HCT116 and +0.12 in MCF7.
Every source-to-target comparison remained above its matched null under the one-sided permutation statistic, with the smallest observed matched-null p-value resolution p = 0.0005 and the largest p = 0.0125. The effect sizes make the more important point: diagonal values were much larger than off-diagonal values. The SJSA-defined set was essentially neutral in HCT116 despite being strongly positive in SJSA, while the MCF7-defined set retained a relatively large positive offset in SJSA.
The most defensible interpretation is partial transfer. If O were purely a property of the cell line, source-defined sets would not retain a positive offset in target lines. If O were purely encoded by gene identity, off-diagonal values would approach the diagonal. Instead, both components appear to matter. Sequence-level or RNA-level features may create a baseline propensity for translation regulation, while RNA-binding proteins, stress granules, ribosome availability, transcript stability, and pathway activation may set the context-specific gain.
Independent time courses separate timing from routing
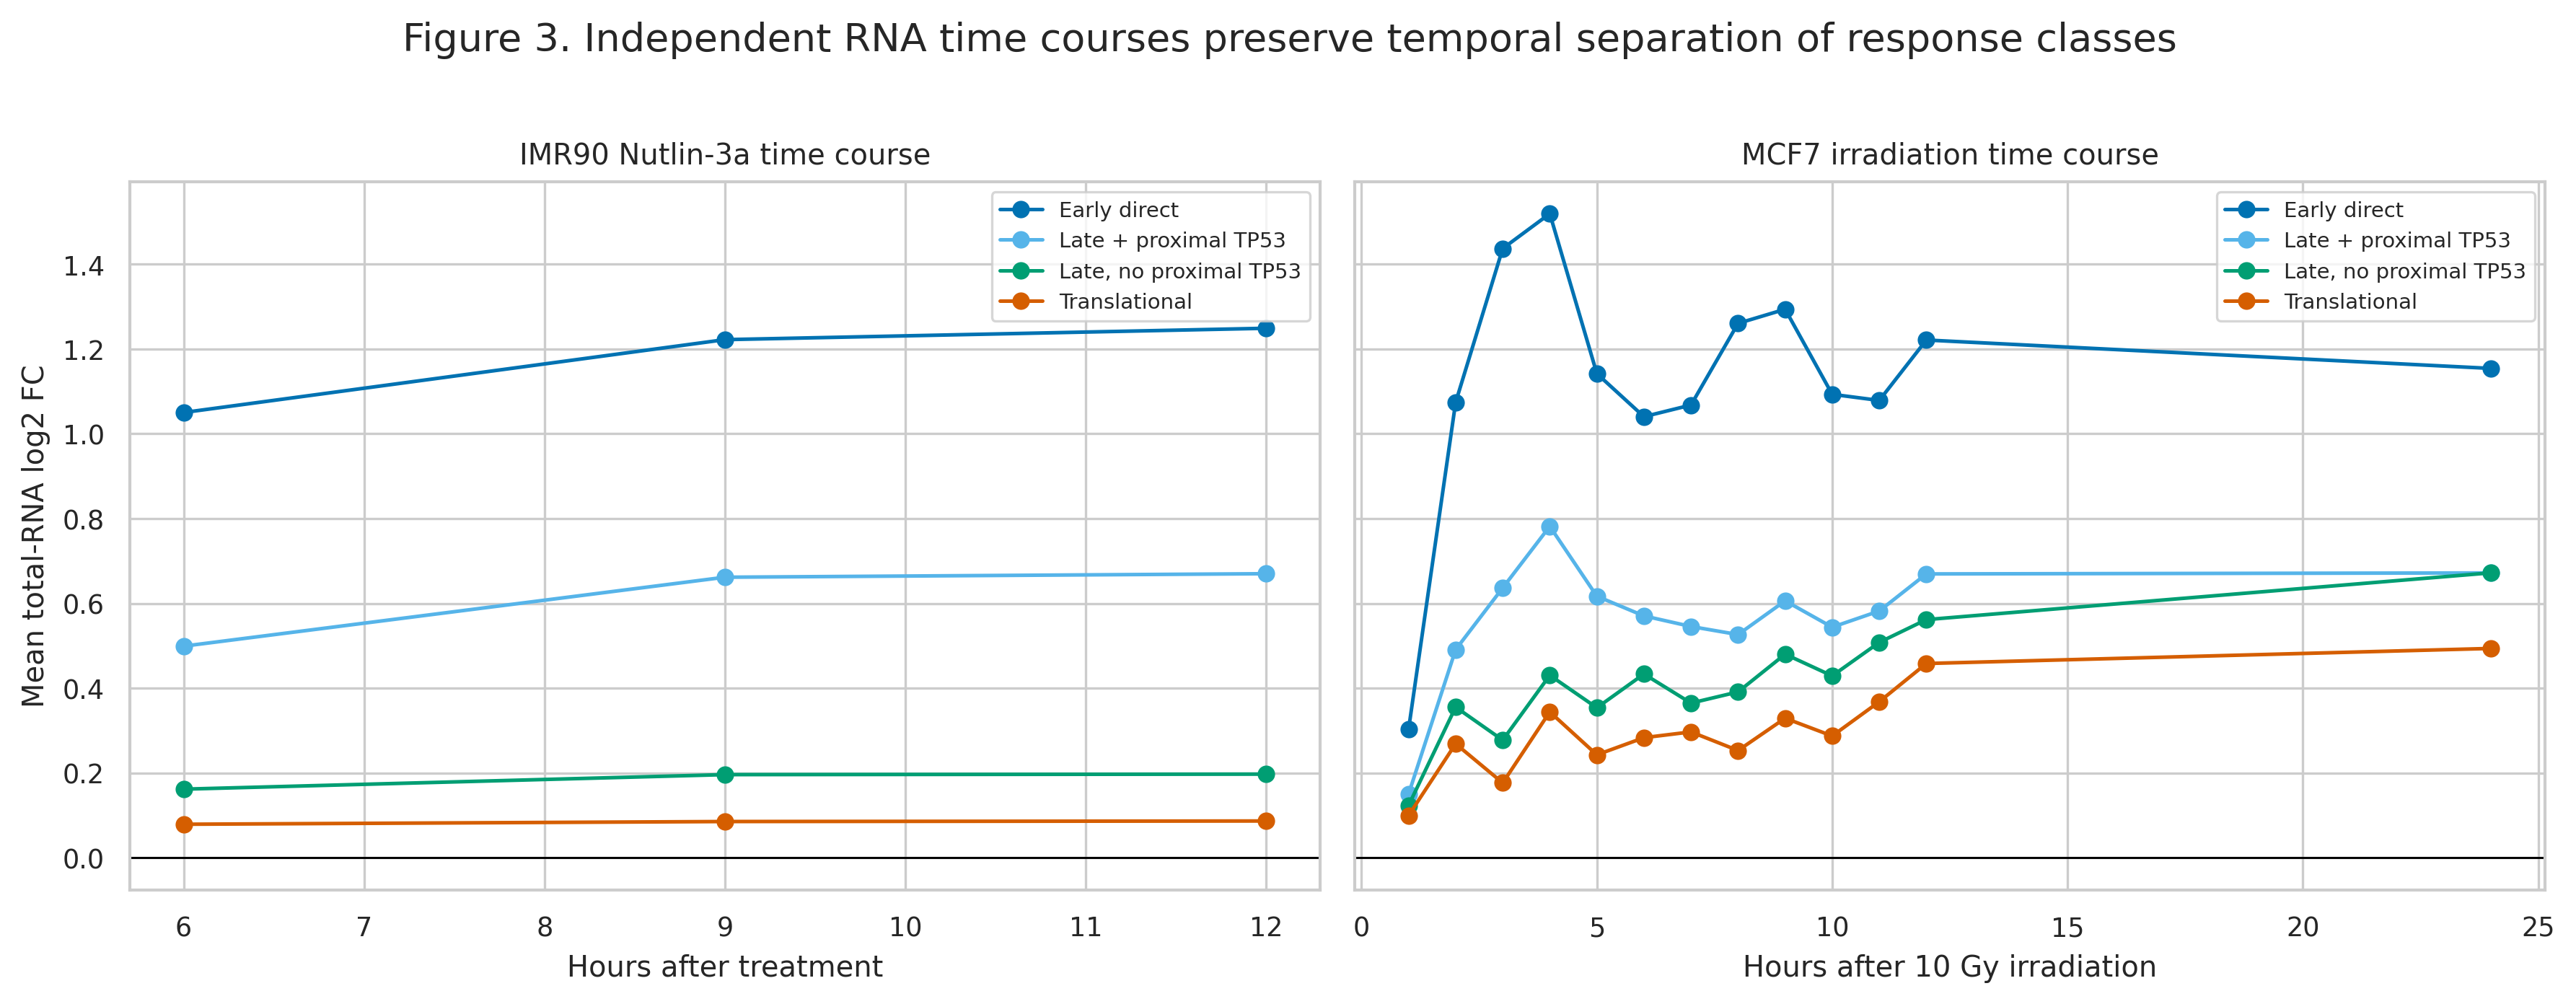
The first independent validation used GSE139003, an IMR90 total-RNA time course after Nutlin-3a treatment at 6, 9, and 12 hours. The primary cell-line class labels were pooled across HCT116, MCF7, and SJSA, then evaluated without using the IMR90 data to redefine the classes. At 6 hours, the early-direct union averaged +1.05 log2 fold change compared with +0.08 for the translational union. At 12 hours, the corresponding values were +1.25 and +0.09. Late-proximal genes were intermediate, averaging +0.50 at 6 hours.
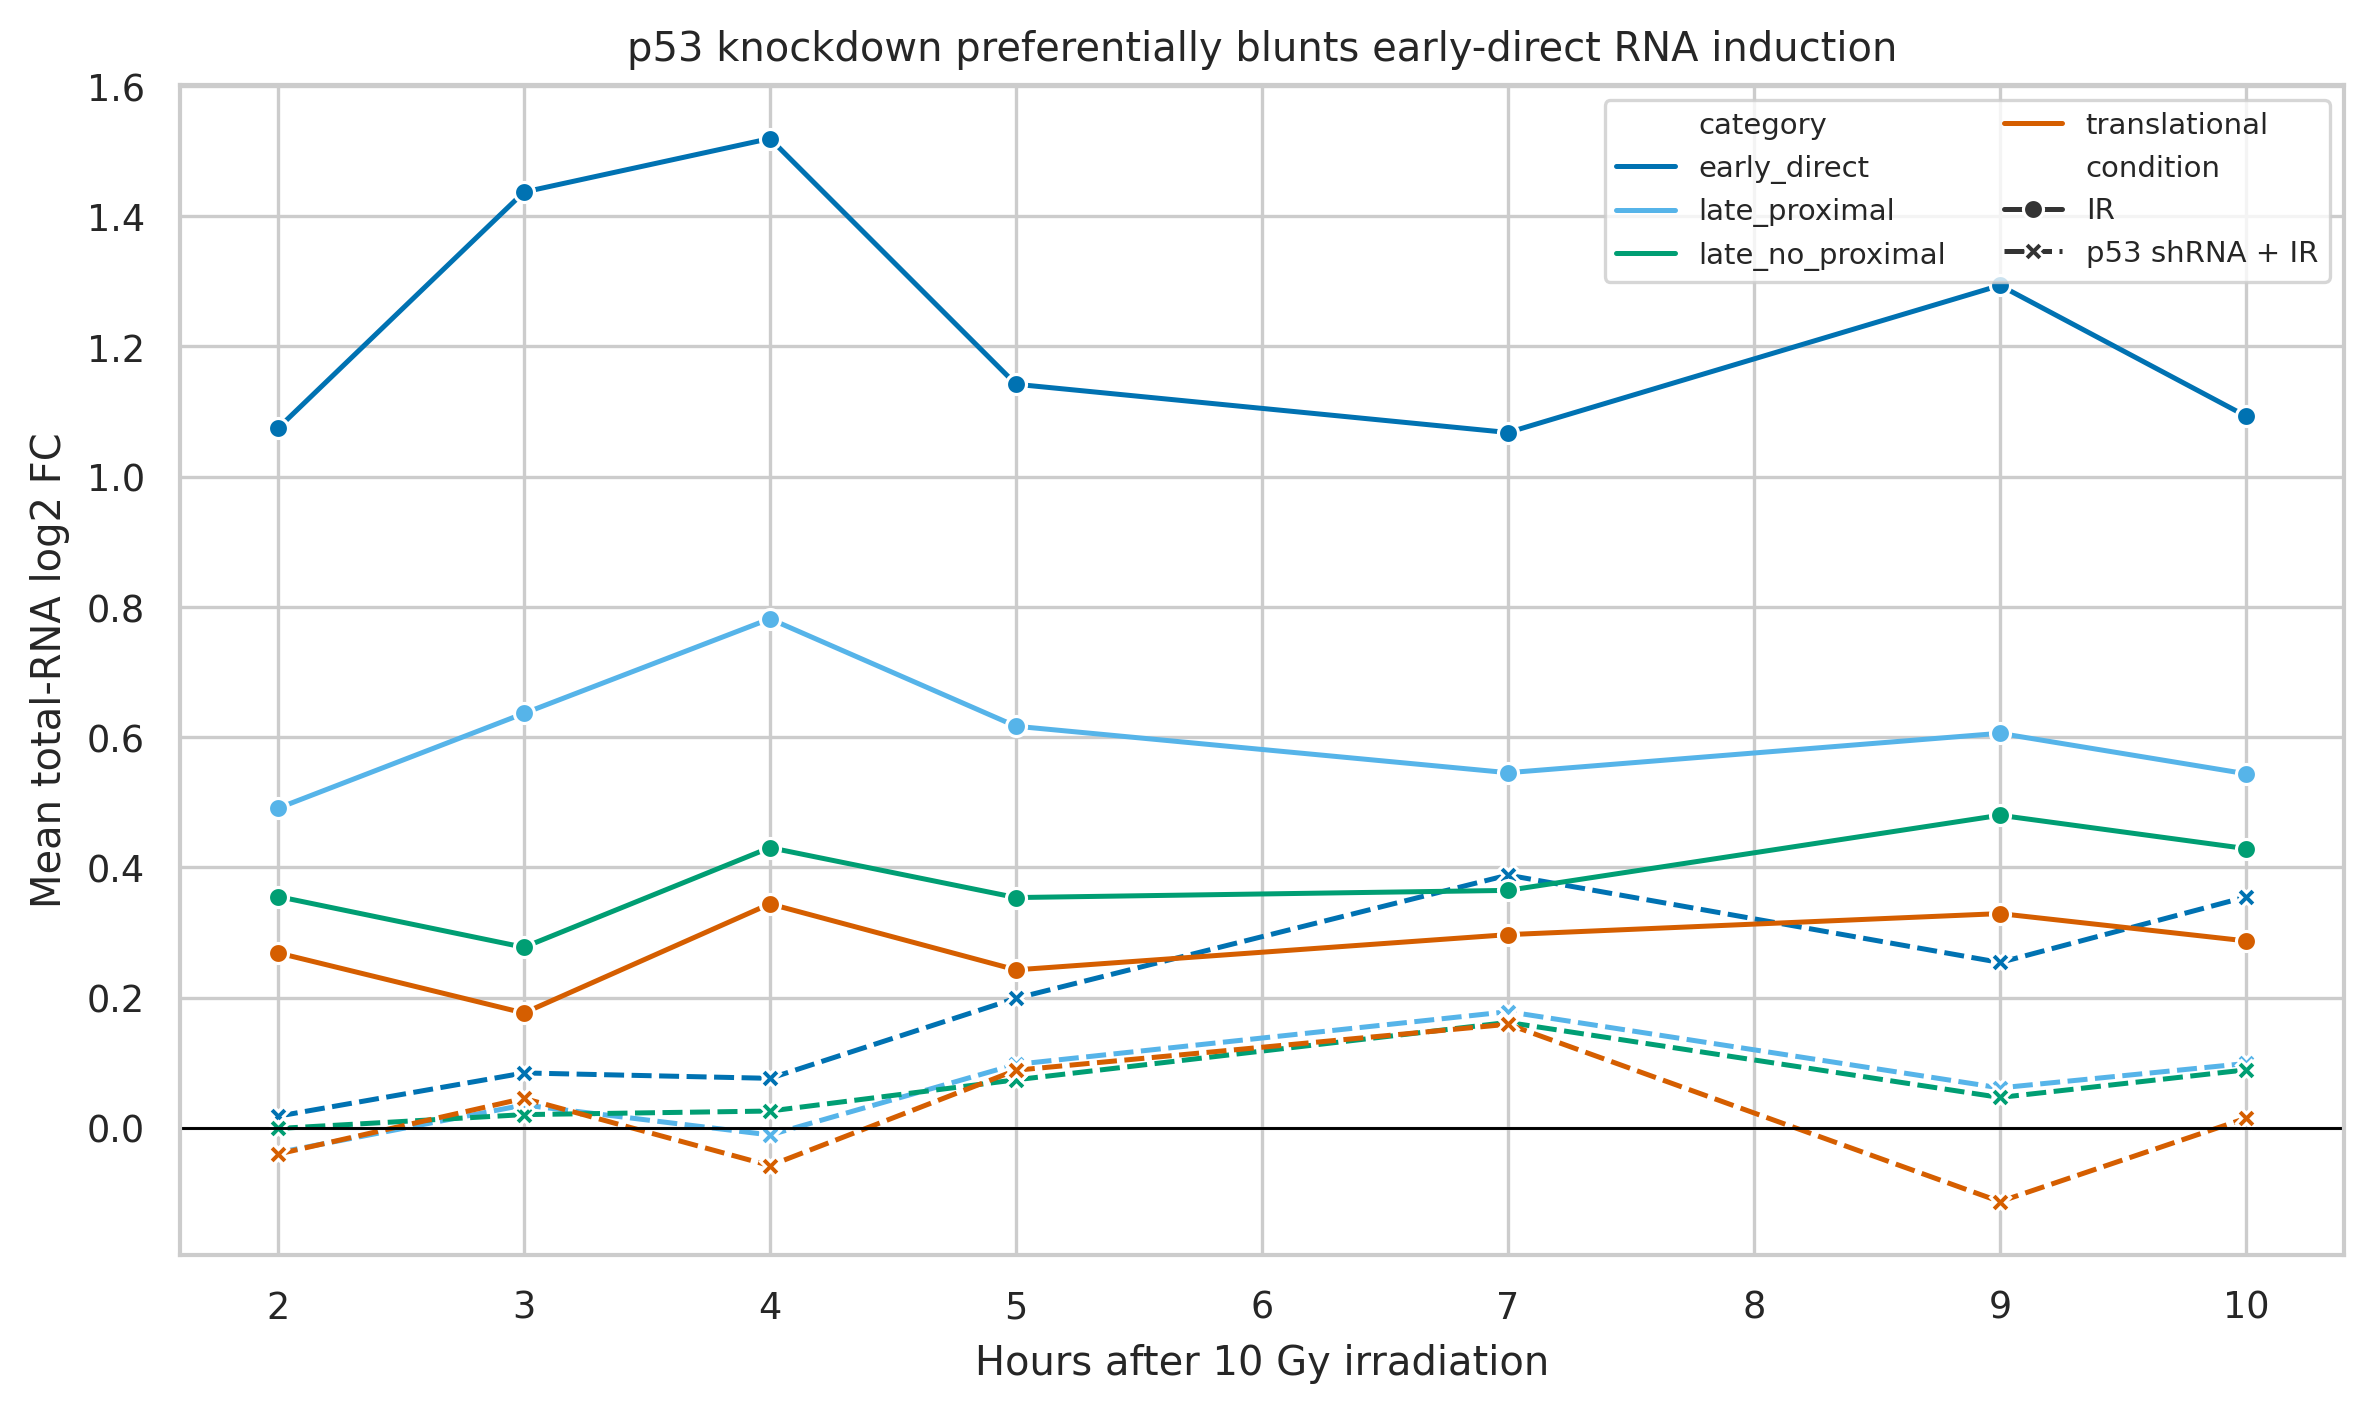
The second validation used GSE100099, in which MCF7 cells were followed after 10 Gy irradiation with a matched p53-shRNA series. At 4 hours, the MCF7 early-direct set averaged +1.52 in p53-proficient cells, while the MCF7 translational set averaged +0.34. In p53-shRNA cells, those values fell to +0.08 and -0.06, respectively. Across the 2- to 10-hour window, the difference between p53-proficient and p53-shRNA early-direct means ranged from +0.68 to +1.44 log2 units. The translational class was also reduced, but generally by a smaller amount, from +0.13 to +0.44 log2 units.
These RNA-only time courses cannot validate polysome routing directly. They do provide an orthogonal check that the source-defined translational group is not merely an early transcriptional group observed at an inconvenient time. They also show that the early-direct group is strongly dependent on p53 in a distinct activation regime.
The validation therefore separates two claims that are often collapsed. Timing is visible in total RNA: early-direct genes rise sooner and more strongly. Routing is visible only when total RNA is compared with the polysome fraction: translational genes acquire disproportionate polysome representation. Independent RNA experiments support the first claim and motivate direct experiments for the second.
A molecular information gate, not a universal p53 translation program
The most useful conceptual result is the separation of three statements. First, p53 activation can produce a strong nascent-transcription response. Second, total-RNA abundance records the combination of synthesis, processing, export, and degradation. Third, polysome association is an additional layer that reflects whether RNA molecules are made available to translating ribosomes. The data show that these layers correlate, but they do not behave as interchangeable readouts.
The early-direct class has high G and high T, as expected for direct transcriptional activation. Its O is near zero in HCT116 and SJSA and strongly negative in MCF7. The translational class has low G and low T, but positive O in every primary cell line. This is the signature of a selective routing layer: some genes acquire more polysome representation than their total-RNA abundance would predict, while others are depleted relative to their total abundance.
The cross-line analysis adds an important constraint. If O were purely a property of the cell line, source-defined sets would not retain a positive offset in target lines. If it were purely encoded by gene identity, off-diagonal values would approach the diagonal. Instead, the off-diagonal signal is positive but smaller and uneven. A plausible model is that sequence-level or RNA-level features create a baseline propensity for translation regulation, while cell-state variables set the gain of that propensity.
This is a molecular-biology claim, not a clinical claim. Its medical relevance is mechanistic: disease-associated mutations, oncogenic stress, and therapeutic p53 activation can change not only which transcripts are produced but also which transcripts become functionally available to ribosomes. A gene-expression signature may therefore fail to predict protein output if it ignores the routing layer.
The result also extends the Schrödinger-Watson-Smith trajectory. Schrödinger made the physical organization of heredity an urgent problem. The molecular-biological generation that followed made nucleic-acid structure central to the explanation of heredity. Smith’s site-directed mutagenesis made that information experimentally alterable. This study asks a later question: after information has been transcribed, where does it go? The answer suggested by these data is that the central dogma is not a conveyor belt with a single output. It is a sequence of regulated physical filters.
Limitations and experimental predictions
The translational class labels were inherited from the original study. Because the source classification used total-RNA and polysome behavior, the positive O result within those classes is partly expected by construction. The primary offset should therefore be treated as confirmation and quantification of the class architecture, not as a wholly independent discovery.
Polysome-associated RNA is a proxy for ribosome engagement, not a direct translation-rate measurement. It can be influenced by fractionation efficiency, transcript stability, polyadenylation, and changes in the total polysome pool. The primary datasets have two biological replicates per condition, and different cell lines have distinct baseline transcriptomes. The matched permutation procedure reduces, but does not eliminate, confounding by abundance and total-RNA response.
The independent validations measure total RNA only. They strengthen the temporal and p53-dependence components of the model but do not reproduce the polysome offset in the same cells. Finally, this analysis does not establish that any particular RNA-binding protein or cis-regulatory sequence causes the cross-line transfer. Those are follow-up hypotheses.
The model makes four concrete predictions. First, in each cell line, genes from a source-defined translational class should show altered ribosome loading without a proportionate change in total RNA during acute p53 activation. Second, the same genes should lose or reverse their polysome offset after depletion of the cell-state factor that supplies the contextual gain, even if p53 binding remains intact. Third, TP53-null polysome profiling should distinguish a p53-dependent routing response from the p53-independent baseline translation of transcripts classified as translational. Fourth, protein-level measurements should correlate more strongly with P than with T for the translational class, but this relationship should vary across cell lines.
Methods and reproducibility
The primary analysis used the GSE86222 super-series and three relevant subseries: GSE86221 total RNA-seq, GSE86219 polysome-associated RNA-seq, and GSE86165 GRO-seq. The design used HCT116, MCF7, and SJSA cells treated with DMSO or 10 microM Nutlin for 12 hours for total RNA, with matched polysome RNA. GRO-seq used the corresponding DMSO/Nutlin conditions and measured nascent transcription. The HCT116 total-RNA series included both TP53 wild-type and TP53-knockout cells.
Independent validation used GSE139003, an eight-sample IMR90 experiment with DMSO and Nutlin-3a at 6, 9, and 12 hours, and GSE100099, a 90-sample MCF7 time-course series containing 10 Gy irradiation, p53-shRNA controls, and additional conditions. Only the p53-proficient irradiation and p53-shRNA RNA-seq samples were used for the validation figures.
Gene classes were read from Supplemental File S5 of Andrysik et al. The four categories were retained exactly as named in the source study: early direct, late with proximal TP53 binding, late without proximal TP53 binding, and translational. Upregulated and downregulated sets were kept separate. The translational category is therefore a source-defined class, not a class rediscovered by this script.
For each count matrix, gene-specific geometric means were calculated across samples, followed by median-of-ratios sample size factors. Normalized counts were transformed as log2(count + 0.5). For every assay and cell line, FC = mean(log2 treated) - mean(log2 control). The assay-specific effects were named T for total RNA, P for polysome-associated RNA, G for GRO-seq, and O = P - T for the translation offset. GRO-seq gene identifiers containing transcript suffixes were collapsed to gene identifiers before normalization.
Class mean confidence intervals were generated by resampling genes with replacement 3,000 times. The direct comparison of translational versus early-direct offsets used 5,000 label permutations within each cell line. Cross-line transfer used 2,000 matched null draws for each source/target pair. Target genes were binned approximately by baseline total-RNA abundance and total-RNA response; each source-set gene was replaced by a target-background gene from the same two-dimensional bin when possible. The reported one-sided p-value was the fraction of null means at least as large as the observed target mean, with a +1 correction in the numerator and denominator.
Reanalysis fold changes were compared with the original authors’ significant-gene tables in Supplemental Files S2 and S3 using Spearman correlation and median absolute error. All input matrices, supplemental workbooks, analysis code, output tables, and figure files are included with the local manuscript package. A fixed seed is recorded in results/analysis_manifest.json.
All data used here are public laboratory-generated cell-line datasets deposited in NCBI GEO. This work involved no new human or animal experimentation and is not peer-reviewed. No clinical or public-health inference is intended. No conflicts of interest are declared.
Source record
References
- 01
Schrödinger, E. (1944). What Is Life? The Physical Aspect of the Living Cell. Cambridge University Press. Historical context: https://www.nobelprize.org/prizes/medicine/1962/perspectives/
- 02
Judson, H. F. (1996). The Eighth Day of Creation: Makers of the Revolution in Biology. Cold Spring Harbor Laboratory Press.
- 03
Nobel Prize Outreach. Michael Smith — Facts. Nobel Prize in Chemistry 1993. https://www.nobelprize.org/prizes/chemistry/1993/smith/facts/
- 04
Allen, M. A., Andrysik, Z., Dengler, V. L., et al. (2014). Global analysis of p53-regulated transcription identifies its direct targets and unexpected regulatory mechanisms. eLife, 3, e02200. https://doi.org/10.7554/eLife.02200
- 05
Andrysik, Z., Galbraith, M. D., Guarnieri, A. L., et al. (2017). Identification of a core TP53 transcriptional program with highly distributed tumor suppressive activity. Genome Research, 27(10), 1645–1657. https://doi.org/10.1101/gr.220533.117. Open article: https://pmc.ncbi.nlm.nih.gov/articles/PMC5630028/
- 06
Hafner, A., Stewart-Ornstein, J., Purvis, J. E., et al. (2017). p53 pulses lead to distinct patterns of gene expression albeit similar DNA-binding dynamics. Nature Structural & Molecular Biology, 24, 840–847. https://doi.org/10.1038/nsmb.3452
- 07
Love, M. I., Huber, W., & Anders, S. (2014). Moderated estimation of fold change and dispersion for RNA-seq data with DESeq2. Genome Biology, 15, 550. https://doi.org/10.1186/s13059-014-0550-8
- 08
NCBI Gene Expression Omnibus. GSE86222 super-series. https://www.ncbi.nlm.nih.gov/geo/query/acc.cgi?acc=GSE86222
- 09
NCBI Gene Expression Omnibus. GSE86221 total RNA-seq. https://www.ncbi.nlm.nih.gov/geo/query/acc.cgi?acc=GSE86221
- 10
NCBI Gene Expression Omnibus. GSE86219 polysomal RNA-seq. https://www.ncbi.nlm.nih.gov/geo/query/acc.cgi?acc=GSE86219
- 11
NCBI Gene Expression Omnibus. GSE86165 GRO-seq. https://www.ncbi.nlm.nih.gov/geo/query/acc.cgi?acc=GSE86165
- 12
NCBI Gene Expression Omnibus. GSE139003 IMR90 Nutlin-3a time course. https://www.ncbi.nlm.nih.gov/geo/query/acc.cgi?acc=GSE139003
- 13
NCBI Gene Expression Omnibus. GSE100099 MCF7 irradiation/p53-shRNA time course. https://www.ncbi.nlm.nih.gov/geo/query/acc.cgi?acc=GSE100099